How much rain do we usually get?
There are three common answers to this: the mean (average), the median (halfway point) and the mode (most common). For a “normal distribution” these three are all the same, but in the case of Santa Barbara’s yearly rainfall they are not.
| Mean | 18.0 inches |
| Median | 15.3 inches |
| Mode | 13.4 inches |
Let us look at the rainfall distribution pattern for Santa Barbara. Here I use the horizontal axis to displaying the number of inches of rain that fell in a year (rounded down to the nearest inch) against the count of the number of years that had that much rain. (These data are available from the county public works department.)

Santa Barbara’s historical rainfall data stretches back (patchily) to 1868. All in all there are 145 years of data (as of Nov 2016).
The Mode
The first problem with using the mode is calculating it. SB’s yearly rainfall is reported in hundredths of an inch. This level of precision means it is extremely unlikely that any two years will have exactly the same amount of rainfall, so there is no amount that occurs most frequently.
That, of course, is easily solved by dropping precision and just looking at the number of inches that fell in a year (as I have done in the graph above). But there’s a hidden problem with this method. I lumped years together by having a series of intervals that start at 0. But suppose I started at .5 inches instead? If this were a normal distribution that wouldn’t make much difference, but here…

The distribution looks quite different now. That tends to argue against the utility of the mode.
Probably if I had several thousands of years of data (and the climate didn’t change in that period) much of this variation would smooth out. But I’ve only got 145 years, and the climate is so variable that this isn’t enough.
Now let’s compare our actual distribution to a normal distribution centered on the mode and with a standard deviation set to the square root of the variation about the mode.
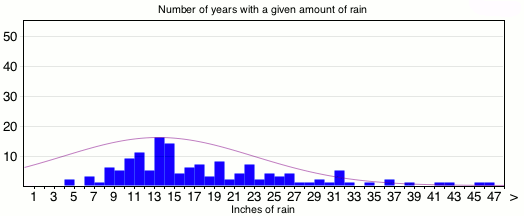
They do not look alike. Part of the problem is that there can never be less than no rain, but the normal distribution acts is if there could be. The variation less than the mode is much less than the variation above the mode (a range of 9 inches below, but 35 inches above).
The mechanism I choose to calculate the mode is to create a series of bins, each one inch wide and offset from one another by .1 inches. So the first bin would count all years that had between [0,1) inches, the second bin [.1,1.1), and so forth. Clearly any give year will end up in 10 bins rather than just one (but that’s fine). Then I look for the bin with the most number of years. This method suggests that the mode is at 13.4 inches — or in the bin counting years where the rainfall was between [12.9,13.9) inches.
But this does not produce stable results. Below is a graph showing the mean (blue), median (green), mode (red) of accumulated rainfall as the year progresses (rain years in Santa Barbara start in September).

(Click on the graph to see a more legible version)
The mean describes a very smooth curve. The median has small bumps, but is pretty smooth. On the other hand the mode dances all over the place with a 10 inch jump in April – from 18 inches down to 8.
Again if I had a much larger sample, presumably these fluctuations would calm a bit, but for the noisy mid-sized dataset I have available the mode does not provide a useful tool.
The Mean
The average is what we usually think of as the best metric for looking at the mid-point of a distribution. But with Santa Barbara’s rainfall it doesn’t work very well.
Because we occasionally get 45+ inches of rain this distorts the mean in a way that is not useful when trying to figure out what a normal year looks like. In fact about 61% of years have less rainfall than the average, which makes the average seem rather unusual.

The Standard Deviation
The standard deviation is defined as the square root of the variation about the mean (or as the variation about the point which minimizes the variation — which happens to be the mean).
As the mean isn’t useful to us, one might presume that the standard deviation is also not much use.
However that’s to some extent a question of semantics, we could examine the square root of the variation about the median instead.
Here we once again bump up against the asymmetry of our distribution. There is simply more variation above the median than there is below. Calculating the square root of the variation for rainfall below the median gives a value of 4.5 inches, while that above the median is 11.6, and the combined value is 8.8.
So perhaps we should look at negative and positive variation about the median instead of one combined number?

(the median is the dark green line, the light green solid lines show the positive and negative “standard deviation”s from the median, and the dashed lines show percentiles)
The negative 1 “standard deviation” line tracks close to the 15th percentile, and the positive 1 “standard deviation line tracks close to the 85th percentile. In a normal distribution the 1 standard deviation lines should track the 15.9th percentile and the 84.1th percentile. So my peculiar definition seems as if would describe the variations of this distribution comparably to the standard definition for a normal distribution.
But it’s so complicated to explain and use, that for most purposes using the median with percentile lines is probably better.
A better viewpoint
My friend Dave suggested looking at the logarithms of the rainfall to see if that revealed a better pattern. And it does.

It still isn’t perfect, but the mean and median have moved closer together and the standard deviation is similar on both sides of the mean. The mode is still in the wrong place for a normal distribution.
| Mean | 16.3 inches |
| Median | 15.3 inches |
| Mode | 13.5 inches |
